Miscellaneous reading
There are some files which don’t fit within the standard CMIP6 output but which we would nonetheless like to read. For this purpose, we have netcdf_scm.misc_readers. At the moment it only helps us to read hemispheric-mean data for CMIP6 input concentrations, but more options can be added as needed (pull requests welcome :)).
CMIP6 concentrations input
The CMIP6 input concentrations are provided on a grid. However, hemispheric mean data was also provided. These can be read as shown below.
[1]:
# NBVAL_IGNORE_OUTPUT
import os.path

import matplotlib.pyplot as plt

from netcdf_scm.misc_readers import read_cmip6_concs_gmnhsh
[2]:
TEST_DATA_DIR = os.path.join("..", "..", "..", "tests", "test-data")
TEST_HISTORICAL_FILE = os.path.join(
    TEST_DATA_DIR,
    "mole-fraction-of-carbon-dioxide-in-air_input4MIPs_GHGConcentrations_CMIP_UoM-CMIP-1-2-0_gr1-GMNHSH_000001-201412.nc",
)
TEST_PROJECTION_FILE = os.path.join(
    TEST_DATA_DIR,
    "mole-fraction-of-carbon-dioxide-in-air_input4MIPs_GHGConcentrations_ScenarioMIP_UoM-MESSAGE-GLOBIOM-ssp245-1-2-1_gr1-GMNHSH_201501-250012.nc",
)
[3]:
# NBVAL_IGNORE_OUTPUT
historical_concs = read_cmip6_concs_gmnhsh(TEST_HISTORICAL_FILE)
historical_concs.head()
[3]:
| time | 0001-01-17 12:00:00 | 0001-02-16 00:00:00 | 0001-03-17 12:00:00 | 0001-04-17 00:00:00 | 0001-05-17 12:00:00 | 0001-06-17 00:00:00 | 0001-07-17 12:00:00 | 0001-08-17 12:00:00 | 0001-09-17 00:00:00 | 0001-10-17 12:00:00 | ... | 2014-03-17 12:00:00 | 2014-04-17 00:00:00 | 2014-05-17 12:00:00 | 2014-06-17 00:00:00 | 2014-07-17 12:00:00 | 2014-08-17 12:00:00 | 2014-09-17 00:00:00 | 2014-10-17 12:00:00 | 2014-11-17 00:00:00 | 2014-12-17 12:00:00 | |||||||||
|---|---|---|---|---|---|---|---|---|---|---|---|---|---|---|---|---|---|---|---|---|---|---|---|---|---|---|---|---|---|---|
| model | scenario | region | variable | unit | variable_standard_name | mip_era | climate_model | activity_id | member_id | |||||||||||||||||||||
| unspecified | historical | World | mole_fraction_of_carbon_dioxide_in_air | ppm | NaN | CMIP6 | MAGICC7 | input4MIPs | unspecified | 277.876678 | 278.231598 | 278.551178 | 278.774658 | 278.706543 | 277.966461 | 276.322845 | 274.719147 | 274.680359 | 275.719604 | ... | 399.020050 | 399.094604 | 398.623932 | 397.337616 | 395.648834 | 394.573456 | 395.026825 | 396.668762 | 398.189087 | 399.179688 |
| World|Northern Hemisphere | mole_fraction_of_carbon_dioxide_in_air | ppm | NaN | CMIP6 | MAGICC7 | input4MIPs | unspecified | 278.555908 | 279.183929 | 279.804108 | 280.321655 | 280.213593 | 278.691864 | 275.406738 | 272.345093 | 272.443939 | 274.555481 | ... | 402.959412 | 403.127563 | 402.125000 | 399.311371 | 395.616882 | 393.376556 | 394.318665 | 397.456665 | 400.321228 | 402.195099 | ||
| World|Southern Hemisphere | mole_fraction_of_carbon_dioxide_in_air | ppm | NaN | CMIP6 | MAGICC7 | input4MIPs | unspecified | 277.197449 | 277.279266 | 277.298248 | 277.227661 | 277.199493 | 277.241058 | 277.238922 | 277.093170 | 276.916809 | 276.883728 | ... | 395.080719 | 395.061676 | 395.122864 | 395.363861 | 395.680786 | 395.770386 | 395.734955 | 395.880859 | 396.056915 | 396.164307 |
3 rows × 24168 columns
[4]:
# NBVAL_IGNORE_OUTPUT
projection_concs = read_cmip6_concs_gmnhsh(TEST_PROJECTION_FILE)
projection_concs.head()
[4]:
| time | 2015-01-16 12:00:00 | 2015-02-15 00:00:00 | 2015-03-16 12:00:00 | 2015-04-16 00:00:00 | 2015-05-16 12:00:00 | 2015-06-16 00:00:00 | 2015-07-16 12:00:00 | 2015-08-16 12:00:00 | 2015-09-16 00:00:00 | 2015-10-16 12:00:00 | ... | 2500-03-16 12:00:00 | 2500-04-16 00:00:00 | 2500-05-16 12:00:00 | 2500-06-16 00:00:00 | 2500-07-16 12:00:00 | 2500-08-16 12:00:00 | 2500-09-16 00:00:00 | 2500-10-16 12:00:00 | 2500-11-16 00:00:00 | 2500-12-16 12:00:00 | |||||||||
|---|---|---|---|---|---|---|---|---|---|---|---|---|---|---|---|---|---|---|---|---|---|---|---|---|---|---|---|---|---|---|
| model | scenario | region | variable | unit | variable_standard_name | climate_model | activity_id | mip_era | member_id | |||||||||||||||||||||
| MESSAGE-GLOBIOM | ssp245 | World | mole_fraction_of_carbon_dioxide_in_air | ppm | NaN | MAGICC7 | input4MIPs | CMIP6 | unspecified | 399.985443 | 400.471680 | 400.829407 | 401.061829 | 400.765961 | 399.643005 | 398.118835 | 397.217529 | 397.855652 | 399.668549 | ... | 581.471252 | 581.205750 | 580.177002 | 578.151550 | 576.184753 | 575.389526 | 576.097717 | 578.050537 | 579.750366 | 580.699402 |
| World|Northern Hemisphere | mole_fraction_of_carbon_dioxide_in_air | ppm | NaN | MAGICC7 | input4MIPs | CMIP6 | unspecified | 403.364502 | 404.067444 | 404.587128 | 404.826294 | 403.919159 | 401.186096 | 397.617981 | 395.575470 | 396.728790 | 400.064789 | ... | 583.975220 | 583.604553 | 581.599060 | 577.361206 | 573.039368 | 571.351440 | 572.867310 | 576.690613 | 580.148682 | 582.227295 | ||
| World|Southern Hemisphere | mole_fraction_of_carbon_dioxide_in_air | ppm | NaN | MAGICC7 | input4MIPs | CMIP6 | unspecified | 396.606384 | 396.875916 | 397.071716 | 397.297333 | 397.612732 | 398.099915 | 398.619690 | 398.859619 | 398.982513 | 399.272278 | ... | 578.967224 | 578.806885 | 578.754883 | 578.941895 | 579.330139 | 579.427612 | 579.328125 | 579.410461 | 579.352112 | 579.171448 |
3 rows × 5832 columns
[5]:
combined_concs = historical_concs.append(projection_concs)
# hack around Pyam's inability to handle NaN for now
combined_concs = combined_concs.timeseries().reset_index()
combined_concs = combined_concs.drop("variable_standard_name", axis="columns")
combined_concs = type(historical_concs)(combined_concs)
[6]:
# NBVAL_IGNORE_OUTPUT
combined_concs.head()
[6]:
| time | 0001-01-17 12:00:00 | 0001-02-16 00:00:00 | 0001-03-17 12:00:00 | 0001-04-17 00:00:00 | 0001-05-17 12:00:00 | 0001-06-17 00:00:00 | 0001-07-17 12:00:00 | 0001-08-17 12:00:00 | 0001-09-17 00:00:00 | 0001-10-17 12:00:00 | ... | 2500-03-16 12:00:00 | 2500-04-16 00:00:00 | 2500-05-16 12:00:00 | 2500-06-16 00:00:00 | 2500-07-16 12:00:00 | 2500-08-16 12:00:00 | 2500-09-16 00:00:00 | 2500-10-16 12:00:00 | 2500-11-16 00:00:00 | 2500-12-16 12:00:00 | ||||||||
|---|---|---|---|---|---|---|---|---|---|---|---|---|---|---|---|---|---|---|---|---|---|---|---|---|---|---|---|---|---|
| model | scenario | region | variable | unit | mip_era | climate_model | activity_id | member_id | |||||||||||||||||||||
| unspecified | historical | World | mole_fraction_of_carbon_dioxide_in_air | ppm | CMIP6 | MAGICC7 | input4MIPs | unspecified | 277.876678 | 278.231598 | 278.551178 | 278.774658 | 278.706543 | 277.966461 | 276.322845 | 274.719147 | 274.680359 | 275.719604 | ... | NaN | NaN | NaN | NaN | NaN | NaN | NaN | NaN | NaN | NaN |
| World|Northern Hemisphere | mole_fraction_of_carbon_dioxide_in_air | ppm | CMIP6 | MAGICC7 | input4MIPs | unspecified | 278.555908 | 279.183929 | 279.804108 | 280.321655 | 280.213593 | 278.691864 | 275.406738 | 272.345093 | 272.443939 | 274.555481 | ... | NaN | NaN | NaN | NaN | NaN | NaN | NaN | NaN | NaN | NaN | ||
| World|Southern Hemisphere | mole_fraction_of_carbon_dioxide_in_air | ppm | CMIP6 | MAGICC7 | input4MIPs | unspecified | 277.197449 | 277.279266 | 277.298248 | 277.227661 | 277.199493 | 277.241058 | 277.238922 | 277.093170 | 276.916809 | 276.883728 | ... | NaN | NaN | NaN | NaN | NaN | NaN | NaN | NaN | NaN | NaN | ||
| MESSAGE-GLOBIOM | ssp245 | World | mole_fraction_of_carbon_dioxide_in_air | ppm | CMIP6 | MAGICC7 | input4MIPs | unspecified | NaN | NaN | NaN | NaN | NaN | NaN | NaN | NaN | NaN | NaN | ... | 581.471252 | 581.205750 | 580.177002 | 578.151550 | 576.184753 | 575.389526 | 576.097717 | 578.050537 | 579.750366 | 580.699402 |
| World|Northern Hemisphere | mole_fraction_of_carbon_dioxide_in_air | ppm | CMIP6 | MAGICC7 | input4MIPs | unspecified | NaN | NaN | NaN | NaN | NaN | NaN | NaN | NaN | NaN | NaN | ... | 583.975220 | 583.604553 | 581.599060 | 577.361206 | 573.039368 | 571.351440 | 572.867310 | 576.690613 | 580.148682 | 582.227295 |
5 rows × 30000 columns
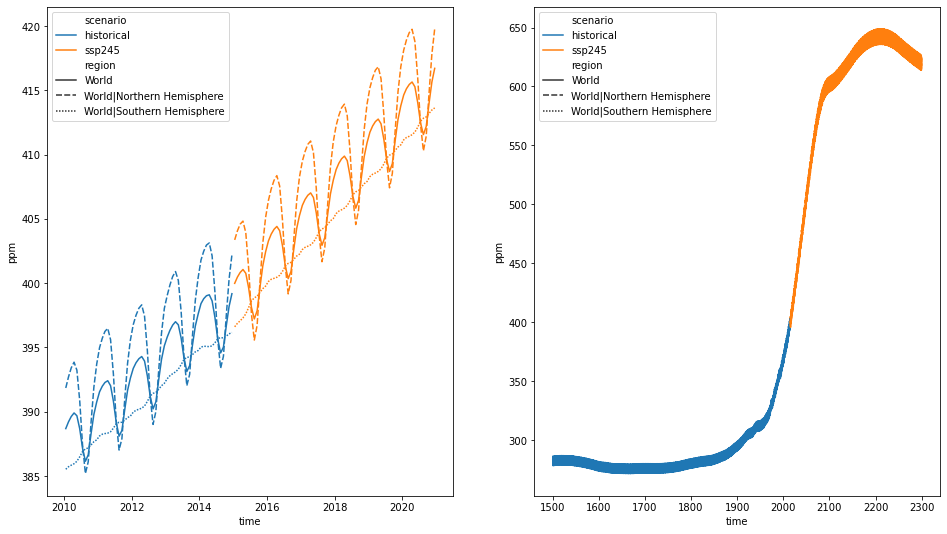
[7]:
# NBVAL_IGNORE_OUTPUT
fig = plt.figure(figsize=(16, 9))

ax = fig.add_subplot(121)
combined_concs.filter(year=range(2010, 2021)).line_plot(
    hue="scenario", style="region", ax=ax
)

ax = fig.add_subplot(122)
combined_concs.filter(year=range(1500, 2300)).line_plot(
    hue="scenario", style="region", ax=ax
);