Year zero handling
The CMIP6 historical concentration data files use a gregorian calendar which has a reference year of zero. There is no year zero in a gregorian calendar so this case cannot be handled by iris. As a result, we provide a simple wrapper to handle this edge case. Note, as we have to read in the entire data file, it can be slow.
[1]:
# NBVAL_IGNORE_OUTPUT
import datetime

import iris
import iris.coord_categorisation
import iris.plot as iplt
from netcdf_scm.iris_cube_wrappers import CMIP6Input4MIPsCube

import matplotlib.pyplot as plt

plt.style.use("bmh")
[2]:
# NBVAL_IGNORE_OUTPUT
cmip6_hist_concs = CMIP6Input4MIPsCube()
cmip6_hist_concs.load_data_from_identifiers(
    root_dir="../../../tests/test-data/cmip6input4mips",
    activity_id="input4MIPs",
    mip_era="CMIP6",
    target_mip="CMIP",
    institution_id="UoM",
    source_id="UoM-CMIP-1-2-0",
    realm="atmos",
    frequency="mon",
    variable_id="mole-fraction-of-carbon-dioxide-in-air",
    grid_label="gr1-GMNHSH",
    version="v20100304",
    dataset_category="GHGConcentrations",
    time_range="000001-201412",
    file_ext=".nc",
)
[3]:
# NBVAL_IGNORE_OUTPUT
cmip6_hist_concs.cube
[3]:
| Mole (1.e-6) | time | sector |
|---|---|---|
| Shape | 24168 | 3 |
| Dimension coordinates | ||
| time | x | - |
| sector | - | x |
| Attributes | ||
| Conventions | CF-1.6 | |
| activity_id | input4MIPs | |
| comment | Data provided are global and hemispheric area-weighted means. Zonal means... | |
| contact | malte.meinshausen@unimelb.edu.au | |
| creation_date | 2016-08-30T18:22:16Z | |
| dataset_category | GHGConcentrations | |
| dataset_version_number | 1.2.0 | |
| frequency | mon | |
| further_info_url | http://climatecollege.unimelb.edu.au/cmip6 | |
| grid | global and hemispheric means - area-averages from the original latitudinal... | |
| grid_label | gr1-GMNHSH | |
| institution | Australian-German Climate & Energy College, The University of Melbourne... | |
| institution_id | UoM | |
| license | GHG concentrations produced by UoM are licensed under a Creative Commons... | |
| mip_era | CMIP6 | |
| nominal_resolution | 10000 km | |
| product | assimilated observations | |
| realm | atmos | |
| references | Malte Meinshausen, Elisabeth Vogel, Alexander Nauels, Katja Lorbacher,... | |
| source | UoM-CMIP-1-2-0: Historical GHG mole fractions from NOAA & AGAGE networks... | |
| source_id | UoM-CMIP-1-2-0 | |
| table_id | input4MIPs | |
| target_mip | CMIP | |
| title | UoM-CMIP-1-2-0: historical GHG concentrations: global and hemispheric means... | |
| tracking_id | hdl:21.14100/3ef0a11f-2ed2-4004-9234-4087c2d41cee | |
| variable_id | mole_fraction_of_carbon_dioxide_in_air | |
| Cell methods | ||
| mean | time | |
| mean | area | |
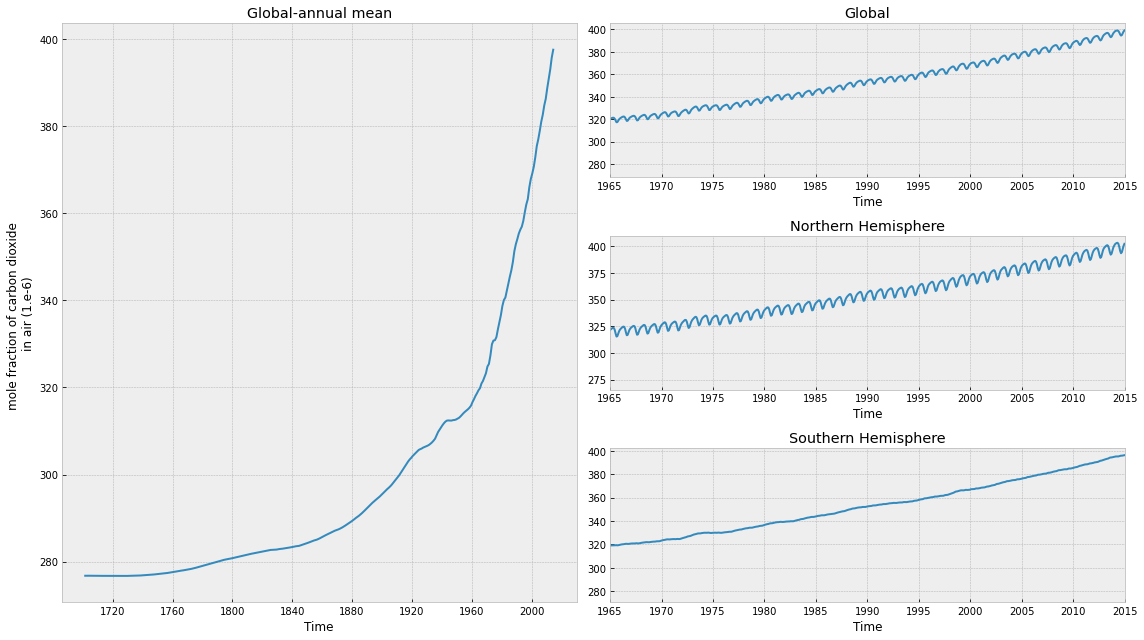
We also make a plot to show how the underlying data looks.
[4]:
# NBVAL_IGNORE_OUTPUT
yearmin = 1700
cube = cmip6_hist_concs.cube.extract(
    iris.Constraint(time=lambda t: t[0].year > yearmin)
)

fig = plt.figure(figsize=(16, 9))

for i in range(3):
    region = cube.extract(iris.Constraint(sector=i))
    for title in region.coord("sector").attributes["ids"].split(";"):
        if title.strip().startswith(str(i)):
            title = title.split(":")[1].strip()
            break

    if "Global" in title:
        plt.subplot(322)
    elif "Northern" in title:
        plt.subplot(324)
    elif "Southern" in title:
        plt.subplot(326)

    iplt.plot(region, lw=2.0)
    xlabel = "Time"
    plt.title(title)
    plt.xlabel(xlabel)
    plt.xlim(
        [datetime.date(1965, 1, 1), datetime.date(2015, 1, 1),]
    )

    if "Global" in title:
        plt.subplot(121)

        iris.coord_categorisation.add_year(region, "time", name="year")
        region_annual_mean = region.aggregated_by(["year"], iris.analysis.MEAN)

        iplt.plot(region_annual_mean, lw=2.0)

        var_name = region.var_name.replace("_", " ")
        var_name = var_name.replace("in", "\nin")
        plt.ylabel("{} ({})".format(var_name, region.units))
        plt.title(title + "-annual mean")
        plt.xlabel("Time")

plt.tight_layout();